

 Shun Nagai
Thailand’s cat food market is growing fast.
According to UK research firm Euromonitor International, the market (retail sales) was worth about US$743.3 million in 2025, roughly 2.2 times its 2020 size. It is forecast to reach about US$1,611.2 million by 2030. These figures appear in a report published in May 2026 by Agriculture and Agri-Food Canada (AAFC) (Source 1).
This growth likely reflects both a rising number of cat-owning households and owners spending more on cat food. Prepared cat food still makes up only about 40% of what cats eat, so the market likely has room to expand further.
This article is for brands that want to sell cat food in Thailand or Southeast Asia, and for D2C brands from any country considering manufacturing in Thailand. It explains where the market stands today and how it could grow.
In particular, it sets out in plain terms the market data that brand founders, product planners and marketers should know before developing a product or entering the market, along with the points to check in advance.
What you will learn in this article
- How much cat-owning households and cat food sales have grown
- What sells across dry food, wet food, treats and price tiers, and which flavours are common in new products
- What it means that prepared food makes up only 40% of what cats eat
- Where cat food is bought and which companies sell it
- What brands selling or manufacturing in Thailand should check before planning
How much have cat-owning households grown?
According to Euromonitor data published by AAFC, about 3.71 million households in Thailand owned cats in 2025. That is 14.2% of all households, up about 490,000 from about 3.22 million in 2020 (Source 1).
Cat-owning households grew at an average of 2.8% a year, faster than the 2.3% for dog-owning households. The cat population was estimated at about 4.8 million in 2025, growing at an average of 5.2% a year from 2020. That is more than double the growth in the dog population (2.3% a year) (Source 1). In absolute numbers, however, there are still about 1.8 times as many dog-owning households (about 6.66 million) as cat-owning households.
Two very different cat counts
The number of cats varies widely by source. K Research, a research centre affiliated with Kasikornbank, projected 1.94 million owned cats for 2025 (Source 2). This appears to differ from Euromonitor’s figure of about 4.8 million in how cats were counted (definitions and estimation methods), so the two cannot be compared directly. The K Research document does not explain in detail how this figure was counted.
The direction of growth, however, is the same. K Research says cats grew at an average of 28% a year from 2021 to 2024, and dogs at 19% (Source 2). Both sets of data show cats increasing faster than dogs.
More cats, changing lifestyles
Why are cats increasing? Euromonitor’s country report (May 2025) points out that the growth is mainly in urban areas. Its view is that more people are living alone or as couples without children, and more of them are choosing cats as companions (Source 1).
A December 2025 report from the US Department of Agriculture’s Foreign Agricultural Service (USDA FAS) touches on the same point. It says that in cities with more condominiums, cats are being chosen because they suit small homes. It also says 37% of households in Bangkok own pets (Source 4).
The change in households also shows up in official statistics. According to preliminary results of the 2025 census from Thailand’s National Statistical Office (NSO), the average household has 2.7 people. That is down from 3.2 in 2010, while the number of households rose from about 20.33 million to about 25.87 million (Source 3). World Bank data also show the share of people living in cities rising from 57.2% in 2020 to 62.8% in 2025 (Source 5).
Krungsri Research (a Thai bank-affiliated research house) also says single-person households keep increasing, a trend it sees as shaping demand for housing, consumer goods and services (Source 6). We have not confirmed cause and effect between these statistics, but these changes point in the same direction as the growth in cat-owning households.
How much has the cat food market grown?
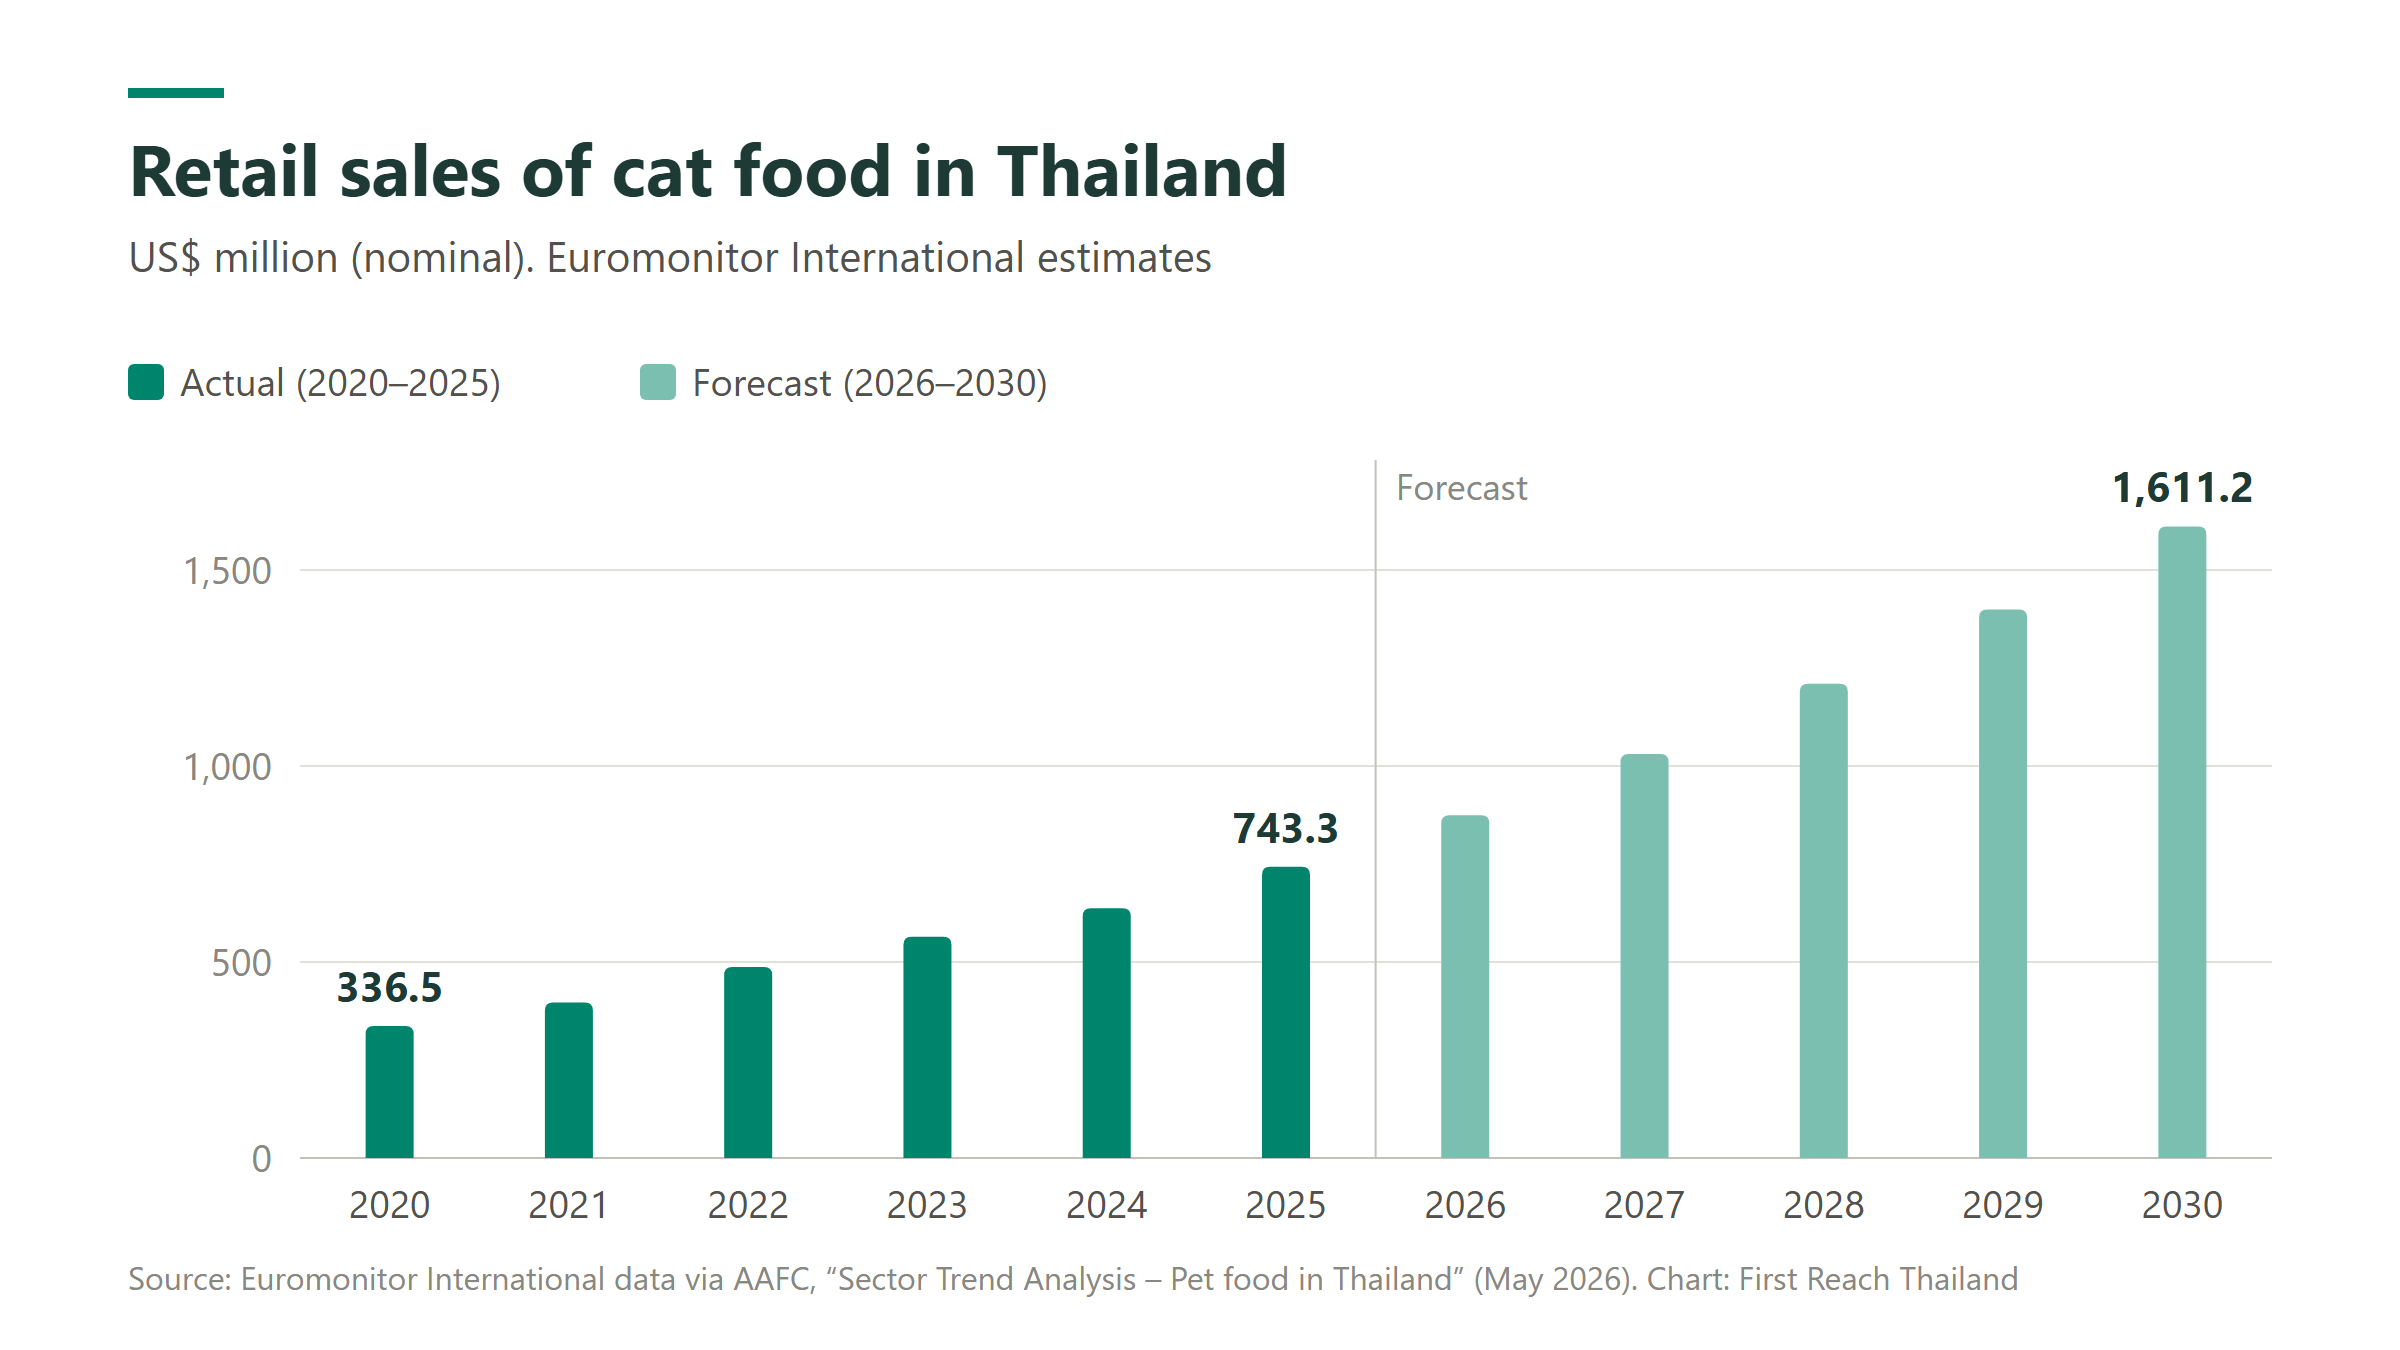
While the number of cats rose to about 1.3 times its 2020 level in five years, cat food sales rose to about 2.2 times (in US dollar terms). Simply dividing sales by the number of cats gives sales per cat of about 1.7 times the 2020 level. The 1.3 and 1.7 figures are our own calculations from the numbers published by AAFC.
The gap between sales and cat numbers
This gap likely comes from higher spending per cat. The data show at least three shifts (Source 1).
- Prepared food’s share rose (from 35.1% to 40.0% of what cats eat, 2020 to 2025)
- Higher-priced segments grew (premium dry up 20.9% a year on average)
- Wet food and treats grew (up 20.0% and 19.1% a year on average, respectively)
These amounts are in nominal US dollars, so they include inflation and exchange rate movements. A separate estimate in baht also projects strong growth. K Research projected Thailand’s domestic pet food market (all pets, including dogs and cats) at 46 billion baht for 2025, up 12% from the previous year (Source 2).
The table below shows sales by segment.
| Segment | 2020 | 2025 | 2030 (forecast) | Average annual growth (2025–2030 forecast) |
|---|---|---|---|---|
| Total cat food | 336.5 | 743.3 | 1,611.2 | 16.7% |
| Dry | 223.5 | 464.9 | 968.8 | 15.8% |
| Dry, mid-priced | 151.0 | 285.5 | 537.4 | 13.5% |
| Dry, premium | 65.2 | 168.6 | 415.1 | 19.7% |
| Dry, economy | 7.2 | 10.8 | 16.3 | 8.6% |
| Wet | 78.7 | 196.1 | 388.3 | 14.6% |
| Wet, mid-priced | 64.4 | 167.5 | 336.3 | 15.0% |
| Wet, premium | 7.9 | 20.6 | 40.5 | 14.5% |
| Wet, economy | 6.4 | 8.0 | 11.5 | 7.5% |
| Treats and toppings | 34.4 | 82.3 | 254.1 | 25.3% |
Figures are in US$ million (nominal). Selected from Euromonitor data (AAFC, published May 2026) (Source 1).
“Sales” in this table means retail-level sales value as estimated by Euromonitor. The price tiers (economy, mid-priced and premium) also follow the company’s own classification (Source 1).
What kind of cat food is selling?
In 2025, dry food made up 62.5% of cat food sales in Thailand, wet food 26.4%, and treats and toppings 11.1% (Source 1). The best-selling segment was mid-priced dry, at US$285.5 million, or nearly 40% of the total. Mid-priced dry and wet together account for about 60% of the total, while economy (low-priced) products make up about 2.5% (our calculation).
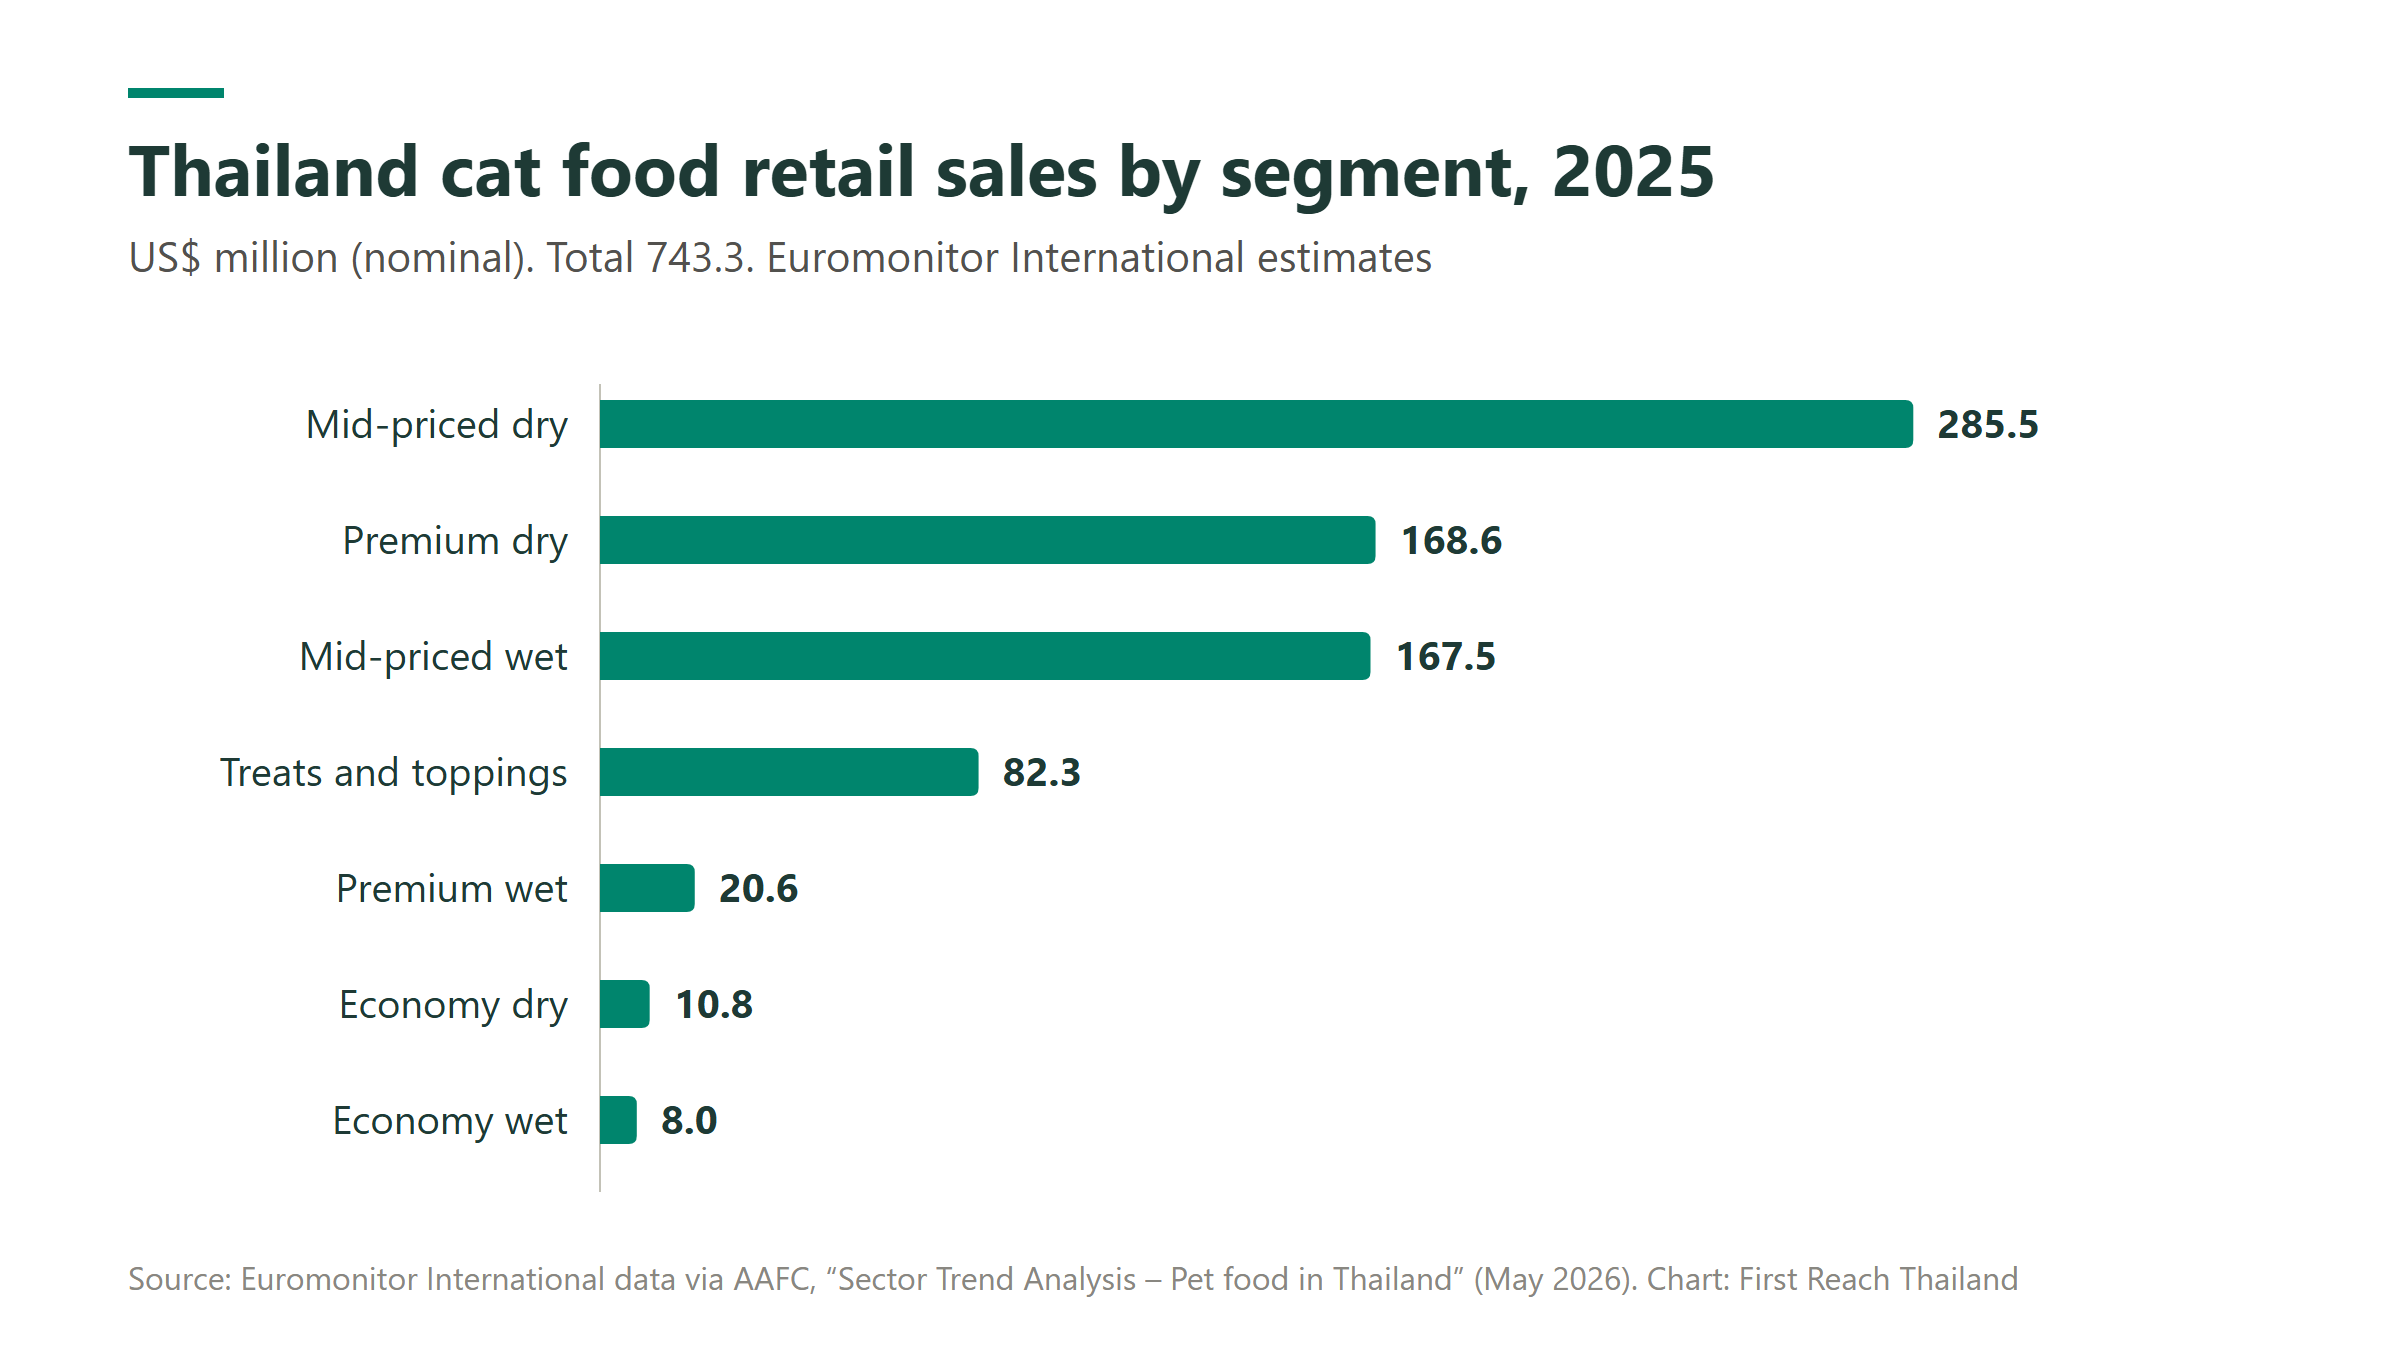
Within dry food, premium is growing quickly, at an average of 20.9% a year from 2020 to 2025 (Source 1). Euromonitor’s country report (May 2025) cites a trend toward premiumisation: interest in high-quality brands, natural ingredients and nutrition designed for specific purposes (Source 1). USDA also gives examples from pet food as a whole, including dogs and cats: ingredients marketed as human-grade, and novel protein sources such as insects (Source 4).
The same Euromonitor report (May 2025) says quality is also rising within the mid-priced tier. Its view is that more owners are adopting mid-priced brands that emphasise quality. Some mix them with the premium food they currently feed, while others switch entirely. The report calls this premiumisation within the mid-priced segment, aimed at price-conscious buyers who still want quality (Source 1). USDA also names mid-priced cat food as a main growth area in 2025, growing by combining ingredients perceived as high quality with affordable prices (Source 4).
Growth in wet food and treats
Wet food (high-moisture pouches and cans) grew at an average of 20.0% a year from 2020 to 2025. About 85% of wet food sales are mid-priced (our calculation). “Treats and toppings” here corresponds to Euromonitor’s “treats and mixers” category. It was the fastest-growing segment in 2025, up 26.0% from the previous year (Source 1).
USDA reports that pet owners in Thailand, including owners of dogs and cats, are experiencing “kibble fatigue” with their usual dry food. It says adding broths, freeze-dried sprinkles and wet food pouches to dry food is spreading (Source 4).
The same shift shows up in new product counts. The AAFC report includes a tally from Mintel’s Global New Products Database (GNPD) (Source 1). New cat food and treat products numbered 105 in 2025, more than double the 49 of the previous year. Treats rose from 14 to 40, and wet food from 9 to 34. These counts include new varieties, packaging or formula changes, and relaunches.
Common flavours in new products
From the same tally, here are the flavours of the 287 new cat products launched from January 2021 to March 6, 2026. Tuna is the most common at 36 products, followed by chicken at 31 and salmon at 18. Unflavoured (plain) products number 16, mackerel 12, and the tuna and chicken combination 8 (Source 1).
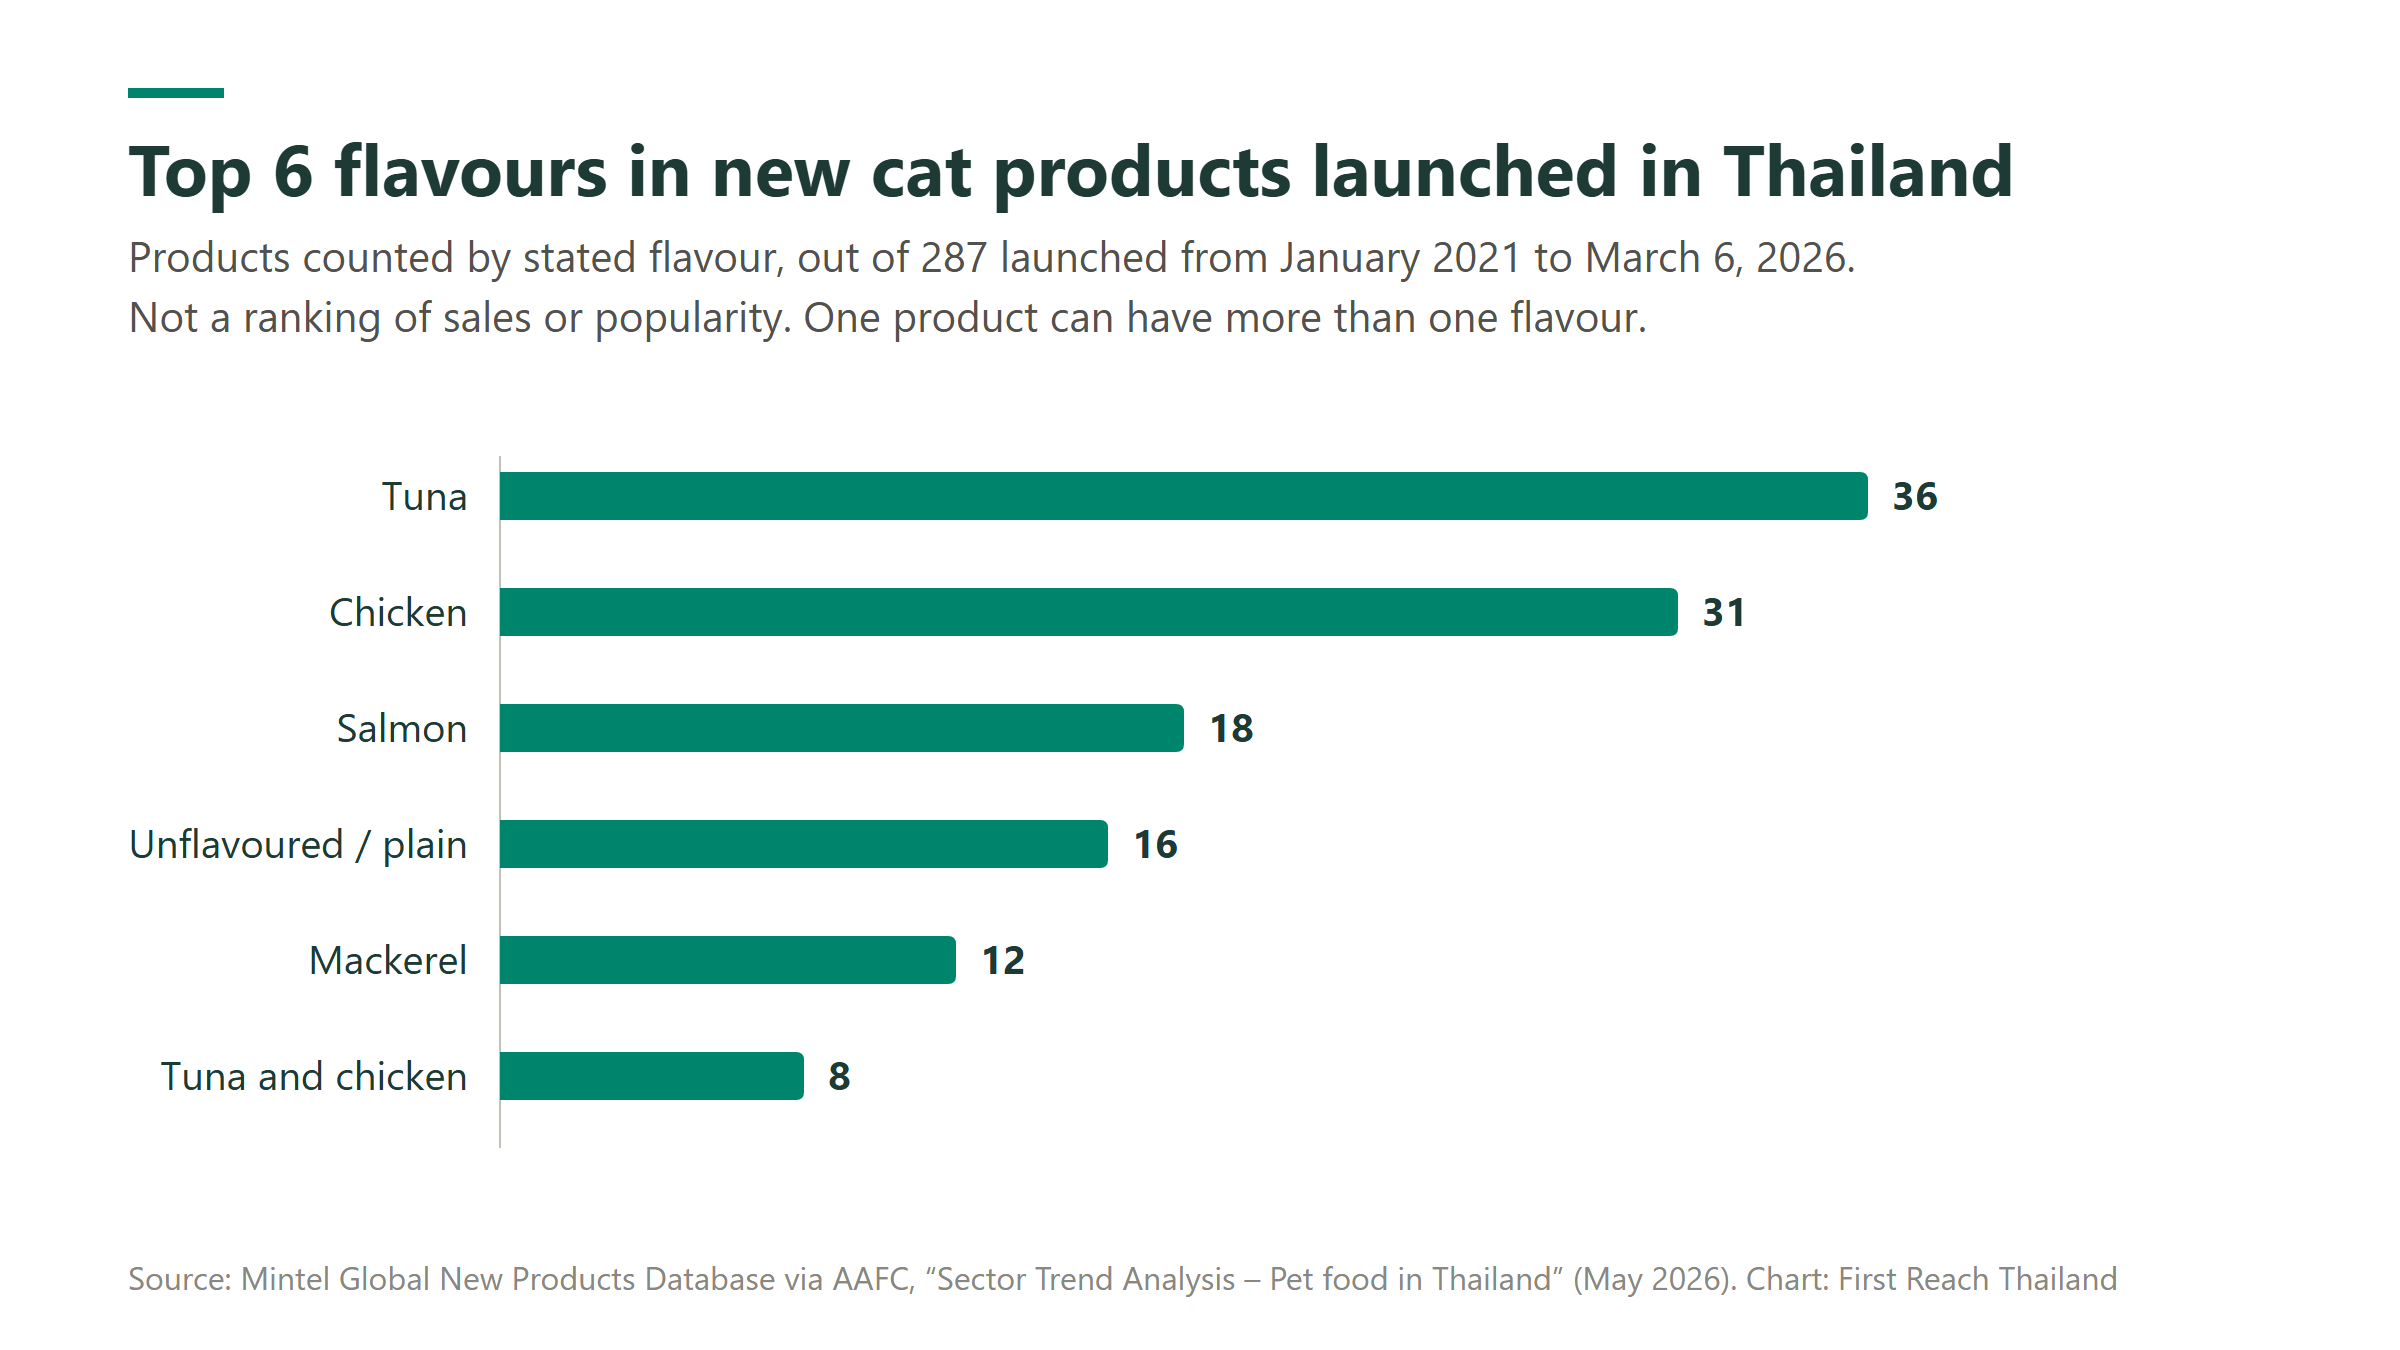
These are counts of new products, not volumes sold. They show which flavours manufacturers launch most often. The top six add up to 121, short of the 287, mainly because there are products with other flavours not listed in the table. Some products, such as tuna and chicken, combine flavours. As far as we could find, there is no recent public survey measuring sales by flavour or owners’ preferences.
The same tally covers the claims most often used on new product labels. In order, they are vitamin/mineral fortified (178 products), functional pet – skin and coat (171), pet – adult (166), functional pet – immune system (128), functional pet – digestion (125) and functional pet – eyesight (117). These are Mintel’s category names (Source 1). Because one product can carry several claims, the total exceeds 287. This shows labelling trends, not evidence of effectiveness. Which claims can be made must be checked against the rules of the country of sale.
Breakdown by life stage
By life stage, adult food dominates. In 2025, dry food broke down into 55.0% adult, 17.5% kitten and 3.5% senior. The remaining 24.0% was other (products not in an age category). Wet food was 66.0% adult and 12.0% kitten (Source 1).
Senior dry food has edged up from 3.0% in 2020 to 3.5% (Source 1). USDA sees unmet demand for products for older pets, such as soft mousses and purées (Source 4). As one hypothesis, the currently small senior segment may expand.
Is there still room to grow?
Prepared cat food made up 40.0% of what cats in Thailand ate in 2025. The remaining 60.0% was non-prepared food (Source 1).
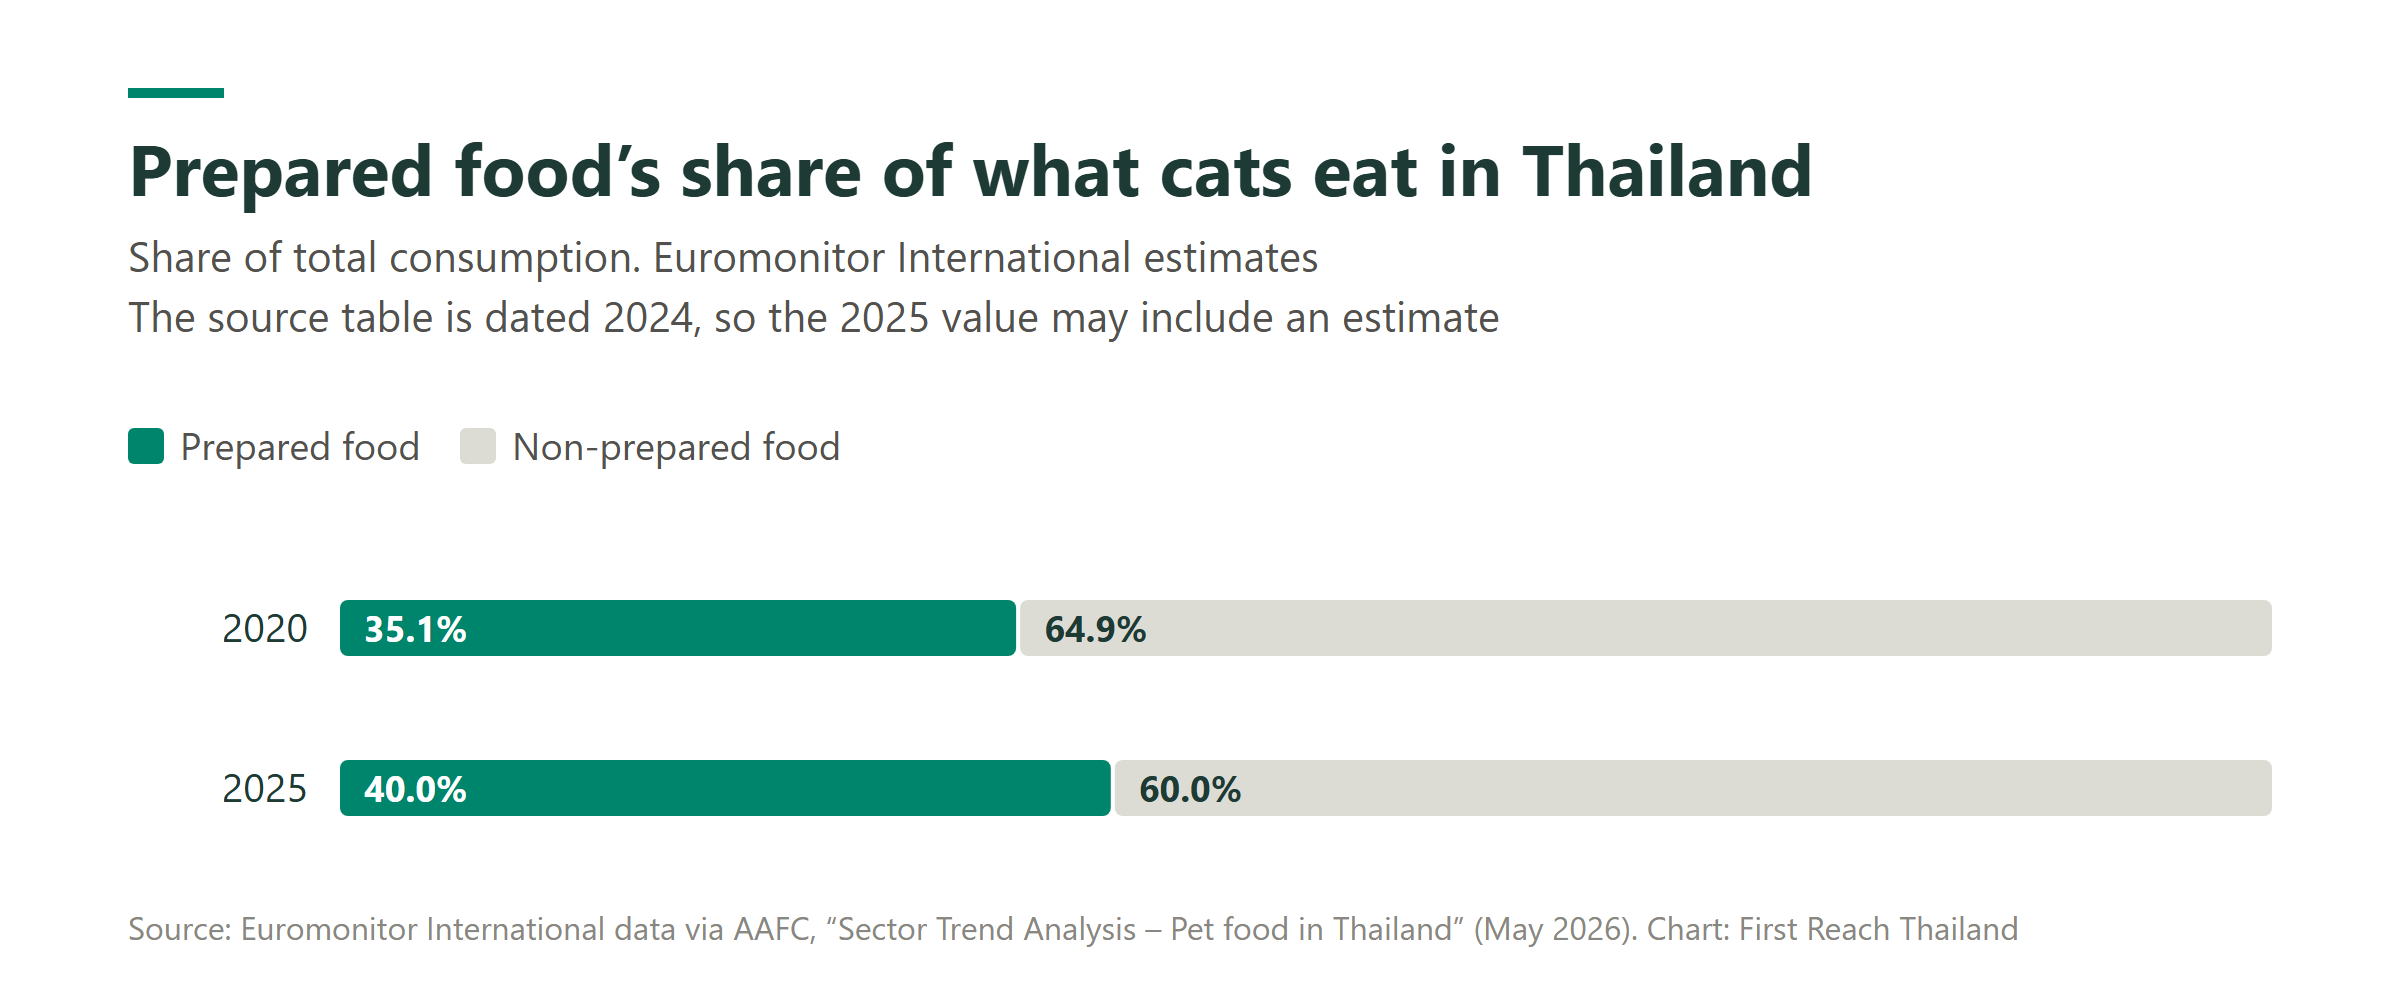
“Non-prepared food” is Euromonitor’s term. The AAFC report gives table scraps as an example in the case of dogs (Source 1). The table’s unit is “% of total consumption”, and the report does not say what basis was used to measure it.
Prepared food’s share rose 4.9 percentage points in five years, from 35.1% in 2020. This table alone is sourced to “Euromonitor International, 2024” (Source 1), so note that it predates the other tables (2026). The 2025 value may include an estimate.
A calculation if prepared food gains share
Suppose prepared food’s share rises from 40% to 50%. Even with the same number of cats, the portion served by prepared food would be 1.25 times today’s level. So even without more cats, the shift to prepared food alone likely leaves room for the market to expand.
The shift is slow, however. Over the past five years, it moved about 1 percentage point a year. If that pace continued, going from 40% to 50% would take about 10 years. Rather than assuming this shift alone, it needs to be read together with trends in cat numbers and spending per cat.
Reading the forecasts with care
Euromonitor forecasts cat food sales to grow at an average of 16.7% a year from 2025 to 2030. Treats and toppings are the fastest, at 25.3% a year (Source 1). The 2030 mix would be 60.1% dry, 24.1% wet and 15.8% treats and toppings (our calculation from the forecast values).
The forecast is one research firm’s estimate. The USDA report also cites a Statista outlook (Source 4) of 10% annual growth through 2030 for the pet food market as a whole. Because one covers only cats and the other the whole market, the figures cannot be compared directly. They should be read on the assumption that figures vary by source.
Where is it bought, and who sells it?
The top sales channel for pet food in Thailand is hypermarkets (large stores selling both food and household goods), with 31.0% of 2025 sales of all pet food, including dogs and cats (Source 1). Among physical stores, specialists such as pet shops follow with 27.8%, then supermarkets with 11.8%.
Channels that are growing
E-commerce is growing fastest, at an average of 15.8% a year from 2020 to 2025, reaching 13.8%. Veterinary clinics also grew, at 14.4% a year, reaching 10.2% (Source 1). Both figures are for all pet food, not just cats.
USDA notes that e-commerce is still just over a tenth of the total, and reports competition on delivery speed, such as quick-commerce services and same-day delivery from stores. It also cites K Research data showing a 42% rise in dog and cat food purchases between 6 and 8 p.m. (Source 4).
Who sells it and where it is made
By company, the top three hold about half the market. In 2024 cat food sales share, Mars (Whiskas, Royal Canin and others) ranked first at 25.6% (Source 1). Second was the Charoen Pokphand Group (Me-O and others) at 15.8%, and third Nestlé (Purina ONE and others) at 10.2%. Private labels, sold by retailers and others under their own names, held just 0.8%.
In treats and toppings, the top two hold more than half (2024): the Charoen Pokphand Group at 31.3% and Inaba Pet Food (Ciao) at 26.5% (Source 1). USDA also writes that, across pet food as a whole, small local brands are carving out their own positions at the high end (Source 4).
As for where it is made, most is made in Thailand. According to USDA, imports in 2024 were about US$122 million, about 9% of the pet food market. The rest was made domestically. China accounted for 39% of imports, up sharply from 3% in 2020 (Source 4).
In Mintel’s tally (published by AAFC), import status was recorded for 137 of the 287 new cat products, and 131 of those were recorded as not imported (Source 1). According to K Research, there were 317 pet food businesses in 2024, 36 of them newly established that year. It also says more companies are entering from other sectors, such as food (Source 2).
Thailand is also a major manufacturing country for export. USDA ranks its 2024 dog and cat food exports second in the world by value. The same report says many manufacturers also act as OEMs, producing under contract for overseas brands (Source 4).
What to check if you sell or manufacture in Thailand
Let’s turn this data into planning decisions. The five points below are an order of checks this article has put together from public data, not an established industry procedure. The data used here covers Thailand only. For other Southeast Asian countries, pet ownership, sales channels and registration systems need to be checked country by country.
1. Price tier
First, decide which price tier to compete in. Mid-priced products have the largest sales. In dry food, premium is growing faster than mid-priced. We recommend checking in stores what would make shoppers choose your product when it sits on the same shelf as the major brands’ core products.
2. Format
Next, consider the mix of dry food, wet food and treats. For example, one possible order is to build around staple dry food and add wet toppers or treats later. Treats and toppings have the fastest forecast growth, but new products are also surging in this segment. Flavours common among new products likely also face more competition in stores. We recommend looking at both growth and competition when deciding the order of entry and the flavours.
3. Sales channel
The pack sizes and product range required may vary by channel. Product design will likely also depend on whether you focus on hypermarkets, specialist stores, e-commerce or veterinary clinics. If e-commerce is the focus, for example, ease of shipping and bulk-purchase units may become part of the design. As one hypothesis, e-commerce, the fastest-growing channel, may be the first channel a new brand tries.
4. Registration and labelling
In Thailand, dog and cat food is designated as “especially controlled animal feed” (อาหารสัตว์ควบคุมเฉพาะ) under the Animal Feed Quality Control Act B.E. 2558 (2015). The designation comes from a notification issued that year, and its clause was replaced by a 2018 notification (No. 5) (Sources 8 and 9). It covers three categories: Complete Pet Food, Therapeutic Pet Food, and Complementary Pet Food, meaning treats and other non-staple products.
Manufacturing or importing this feed for sale requires a business licence and registration of each product. Sellers may also need a separate sales licence (Source 7). Labels must be in Thai, or in a foreign language alongside Thai with the same content, and also show items such as the registration number and the manufacturing and expiry dates (Source 10).
This explanation is based on public materials as of November 2026. Please confirm with Thailand’s Department of Livestock Development (DLD), or a specialist familiar with registration practice, how a specific product is treated.
USDA also advises US exporters to confirm registration requirements, such as labels and claims, permitted ingredients and durability tests, with their importers (Source 4). Registration can only be applied for by a holder of a manufacturing or import licence (Source 11). If you manufacture in Thailand, we recommend checking early who will hold the registration and how the procedures will be divided with the factory. DLD’s e-Feed offers a public search for registrations and more, which can be a useful starting point for market research (Source 12).
5. Factory
Finally, decide where and at which factory to manufacture. Thailand has a manufacturing base for both domestic and export markets. Most of the new products with a recorded import status are not imported. However, dry food, wet pouches and treats often use different equipment, and each factory has formats it does best. We recommend checking whether a factory fits your format and price tier, including whether to manufacture in Thailand or to manufacture elsewhere and import.
References and sources
- Agriculture and Agri-Food Canada (AAFC), “Sector Trend Analysis – Pet food in Thailand” (published May 27, 2026; includes Euromonitor International and Mintel data) https://agriculture.canada.ca/en/international-trade/reports-and-guides/sector-trend-analysis-pet-food-thailand (accessed November 8, 2026)
- Kasikorn Research Center (K Research), “แนวโน้มอุตสาหกรรมอาหารสัตว์เลี้ยงไทย” (Industry Analysis and Outlook No.23, March 17, 2025, in Thai, pp.2–3) https://media.settrade.com/settrade/Documents/2025/Mar/20250317-K-Research-Pet-food-Industry-update.pdf (accessed November 8, 2026)
- National Statistical Office of Thailand (NSO), “Preliminary Report: The 2025 Population and Housing Census (Whole Kingdom)” (2026, p.49) https://www.nso.go.th/nsoweb/storage/title_presentation/2026/20260720083156_80642.pdf (accessed November 8, 2026)
- US Department of Agriculture, Foreign Agricultural Service (USDA FAS), “Thailand’s Pet Food Market 2025” (GAIN Report TH2025-0029, December 3, 2025; assessments by USDA staff, not necessarily official US government policy) https://www.fas.usda.gov/data/thailand-thailands-pet-food-market-2025 (accessed November 8, 2026)
- World Bank, “Urban population (% of total population) – Thailand (SP.URB.TOTL.IN.ZS)” (World Bank Open Data, updated October 8, 2026) https://data.worldbank.org/indicator/SP.URB.TOTL.IN.ZS?locations=TH (accessed November 8, 2026)
- Krungsri Research, “The Single Economy Survey Part 2: ‘Exploring Solo Lifestyles’” (April 28, 2026) https://www.krungsri.com/en/research/research-intelligence/solo-2026 (accessed November 8, 2026)
- Royal Thai Government Gazette, “พระราชบัญญัติควบคุมคุณภาพอาหารสัตว์ พ.ศ. ๒๕๕๘” (Animal Feed Quality Control Act, published March 5, 2015; Sections 4, 15, 17, 22, 35 and 56) https://faolex.fao.org/docs/pdf/tha159736.pdf (accessed November 8, 2026)
- Ministry of Agriculture and Cooperatives of Thailand, “ประกาศกระทรวงเกษตรและสหกรณ์ เรื่อง กำหนดอาหารสัตว์ควบคุมเฉพาะ พ.ศ. ๒๕๕๘” (designation of especially controlled animal feed, Gazette of December 4, 2015; Clause 5) https://legal.dld.go.th/images/Pho%20Roh%20Bor/Khuabkhum-khunnaphap-arhansat/2%20Khunkhum-khunnaphap-arhansat/3.pdf (accessed November 8, 2026)
- Ministry of Agriculture and Cooperatives of Thailand, “ประกาศกระทรวงเกษตรและสหกรณ์ เรื่อง กำหนดอาหารสัตว์ควบคุมเฉพาะ (ฉบับที่ ๕) พ.ศ. ๒๕๖๑” (designation of especially controlled animal feed, No. 5, Gazette of March 28, 2018) https://legal.dld.go.th/images/Pho%20Roh%20Bor/Khuabkhum-khunnaphap-arhansat/2%20Khunkhum-khunnaphap-arhansat/41.pdf (accessed November 8, 2026)
- Ministry of Agriculture and Cooperatives of Thailand, “ประกาศกระทรวงเกษตรและสหกรณ์ เรื่อง กำหนดหลักเกณฑ์การแสดงฉลากและข้อความในฉลากสำหรับอาหารสัตว์ควบคุมเฉพาะ พ.ศ. ๒๕๕๙” (labelling of especially controlled animal feed, Gazette of January 13, 2016) https://legal.dld.go.th/images/Pho%20Roh%20Bor/Khuabkhum-khunnaphap-arhansat/2%20Khunkhum-khunnaphap-arhansat/14.pdf (accessed November 8, 2026)
- Ministry of Agriculture and Cooperatives of Thailand, “ประกาศกระทรวงเกษตรและสหกรณ์ เรื่อง การขอขึ้นทะเบียน การออกใบสำคัญการขึ้นทะเบียน และการแก้ไขรายการทะเบียนอาหารสัตว์ควบคุมเฉพาะ พ.ศ. ๒๕๕๙” (registration procedures for especially controlled animal feed, Gazette of March 18, 2016; Clause 3) https://legal.dld.go.th/images/Pho%20Roh%20Bor/Khuabkhum-khunnaphap-arhansat/2%20Khunkhum-khunnaphap-arhansat/20.pdf (accessed November 8, 2026)
- Department of Livestock Development of Thailand (DLD), “DLD e-Feed (สืบค้น e-License)” https://efeed.dld.go.th/efeed-portal/ (accessed November 8, 2026)